

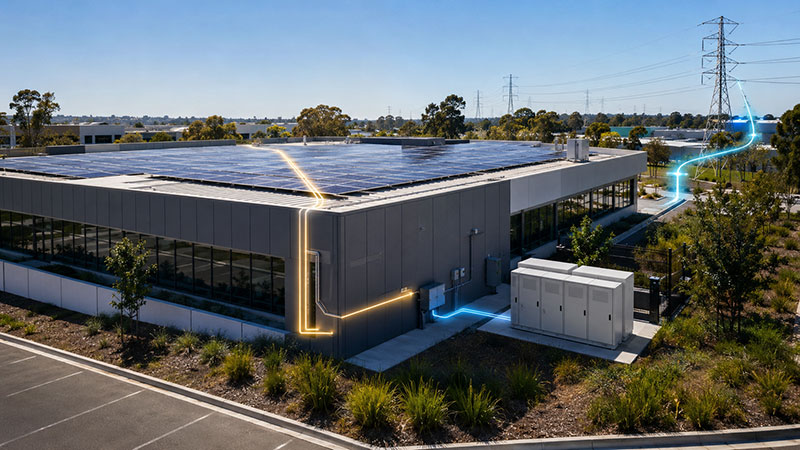
Installing solar is the easy part. Australia proved that a long time ago. By the end of 2025 the country had roughly 4.3 million rooftop systems and 28.3 GW of installed capacity, which is more than the entire coal fleet at 22.5 GW. Rooftop solar delivered 14.2 per cent of national generation in the second half of that year.
The harder question is what happens to the electricity once it is generated. Panels do not tell you whether the energy is being used on site or pushed into a grid that increasingly does not want it at midday. That answer comes from measurement, not from generation figures.
A solar monitoring system closes the gap. It shows when energy is produced, where it is consumed and how much leaves the property. For Australian sites in 2026 that visibility has moved from useful to commercially necessary.
Key Points
A solar monitoring system measures generation, consumption, grid import and export together, rather than showing inverter output alone.
Solar self consumption is the share of generated energy used on site instead of exported, and it now drives most of the financial return.
Feed-in tariffs have fallen sharply, with IPART’s 2026-27 all day benchmark sitting at 3.4 to 6.5 c/kWh against retail rates several times higher.
Export tariffs and free midday electricity windows mean the timing of consumption now matters as much as the volume.
Interval data reveals shiftable loads, unexpected overnight base load and whether an operational change actually worked.
SATEC supplies NMI approved meters and the Expertpower platform to turn those measurements into reliable, auditable energy data.
What a Solar Monitoring System Actually Does
A solar monitoring system measures the performance of a solar installation and presents the data in a usable format. It may draw information from the inverter, from electricity meters, from current sensors or from an energy management platform.
Basic inverter monitoring shows how much the panels generated. That is a single number. A complete system also measures site consumption, energy imported from the grid and surplus exported.
Data can be presented through a web portal, a mobile app or a building management system. Users review live readings, historical trends, costs and alerts. Generation figures only become useful when they sit alongside consumption for the same interval.
Why Inverter Data Alone Falls Short
A strong generation day does not mean a property is capturing value. The panels may perform beautifully at 11am while the site does most of its work at 6am or 7pm.
Consider a 10 kW system that produces 45 kWh on a clear Sydney day. That figure says nothing about whether the property used 40 kWh of it or 4. The financial outcome between those two cases is enormous.
Here is something worth knowing from commissioning work. The single most common fault found on site is a current transformer installed backwards or clamped on the wrong phase. Generation looks fine. The import and export figures are quietly reversed. Nobody notices because inverter monitoring alone gives no cross check.
Accurate metering closes that gap. It confirms whether demand aligns with production and identifies the periods where consumption could move.
Understanding Solar Self Consumption
Solar self consumption is the proportion of generated energy used within the property rather than exported. If a system generates 30 kWh and the site directly uses 18 kWh, its self consumption rate is 60 per cent.
Improving that rate reduces the electricity purchased from the grid. The benefit depends on the retail tariff, the export payment and the operating profile of the site.
The Australian Economics Have Shifted
IPART’s all day feed-in tariff benchmark for New South Wales sits at 3.4 to 6.5 c/kWh for 2026-27, down from 4.8 to 7.3 c/kWh the previous year. Victoria removed its mandatory minimum feed-in tariff entirely from July 2025. Retail rates, meanwhile, have not fallen anywhere near as far.
The gap does the arguing. Every kilowatt hour consumed on site avoids the retail rate. Every kilowatt hour exported earns a fraction of it.
There is a further wrinkle. Ausgrid’s two-way tariff became mandatory for eligible export ready customers from July 2025. It applies a charge to midday exports above a free daily threshold and pays a rebate for exports between 4pm and 9pm. Other networks have introduced similar structures. Exporting hard at noon is no longer a neutral act.
How Monitoring Improves Solar Self Consumption
A monitoring system reveals when surplus generation is available. Households use that information to schedule dishwashers, pool pumps, hot water systems and electric vehicle charging into the middle of the day. Commercial sites adjust production equipment, cooling, water heating and other controllable loads.
Historical interval data matters more than daily totals. Totals hide short demand peaks and long export periods. Interval data lets you compare weekdays against weekends, summer against winter, and last month against this one.
Monitoring also exposes base load. Equipment that runs overnight or through unoccupied periods increases grid purchases without producing anything. Finding those loads improves efficiency independently of solar.
Free Midday Windows Change the Maths
The Solar Sharer Offer commenced on 1 July 2026 for residential customers in New South Wales, South Australia and south-east Queensland who have a smart meter and opt in. It provides three hours of free electricity each day, capped at 24 kWh, running 11am to 2pm in NSW and south-east Queensland and 12pm to 3pm in South Australia. Victoria’s Midday Power Saver scheme begins on 1 October 2026 with an 11am to 2pm window.
For a solar household this creates an interesting choice. Should a load run on your own generation or inside the free window? Without interval data that question is unanswerable. With it, the answer takes about ten minutes to work out.
Comparing Monitoring Approaches
| Approach | What It Measures | Self Consumption Visibility | Best Suited To | Main Limitation |
|---|---|---|---|---|
| Inverter monitoring only | Solar generation | None. Generation is shown in isolation | Basic performance checks on small residential systems | Cannot distinguish energy used on site from energy exported |
| Retailer smart meter data | Grid import and export at the connection point | Partial. Export is visible but generation is not | Households reviewing billing and comparing retail offers | No view of solar output or individual load behaviour |
| Dedicated site metering | Generation, consumption, import and export as separate measured quantities | Full. Self consumption is directly calculated | Homes, small business and commercial sites seeking accurate results | Requires correct CT installation and commissioning |
| Multi-circuit metering | All of the above plus individual circuits or tenancies | Full, with load level attribution | Multi-tenant buildings, embedded networks and larger commercial sites | Higher initial design and installation effort |
What a Solar Monitoring System Should Measure
A useful system distinguishes clearly between solar generation, total site consumption, grid import and solar export. Sites with battery storage need separate measurement of charge and discharge as well.
Accuracy is not a detail. Missing intervals, incorrect CT ratios and poorly configured sensors distort the entire energy balance. Time alignment across devices matters too. If the solar meter and the main meter drift apart by a few minutes, every calculated self consumption figure inherits that error.
Clear graphs, sensible reporting intervals and cost information turn measurements into decisions. Commercial operators usually also need automated reporting, visibility across multiple sites and integration with existing management systems.
One honest constraint. Monitoring cannot move a load that genuinely will not move. A bakery firing ovens at 4am is not going to shift that to noon. What monitoring does is tell you which loads are actually flexible so you stop wasting effort on the ones that are not.
Metering for Solar Monitoring With SATEC
Accurate electrical measurement is the foundation of any dependable solar monitoring system. Meters can be positioned at the grid connection, on the solar generation circuit or at other significant points to capture consumption, generation, import and export.
The EM133-XM is a DIN rail mounted energy meter with Class 0.5S accuracy and four quadrant import and export measurement. It carries National Measurement Institute (NMI) approval for use as an electricity billing meter, which matters where data supports billing, NABERS reporting or Green Star documentation. Sites with bidirectional power flow are exactly what four quadrant measurement exists for.
Where visibility across many circuits is required, the BFM136 branch feeder monitor handles up to 12 three phase circuits, 18 two phase or 36 single phase circuits from one device. Commercial properties use this to separate solar performance from air conditioning, lighting, tenancy loads and EV charging. It is the only multi-circuit solution covered under NMI M 6-1 in Australia as an approved billing meter.
Meter data flows into Expertpower for monitoring, analysis and reporting. Users compare periods, review trends and see how generation interacts with site demand. Residential users can view their own individually submetered usage through the eXpertConnect app, where that submeter is connected to Expertpower and the user is an approved account holder.
Together these components produce an accurate picture of energy movement across a property. That is the difference between watching inverter output and actually managing a site.
Turning Solar Data Into Action
The best monitoring system is the one that gets used. Review when your exports occur. Identify which loads can move. Confirm whether each change produced the result you expected.
Solar performance shifts with season, weather and operating conditions. Tariff structures are shifting too, and faster than they used to. Ongoing measurement lets an energy strategy evolve instead of relying on assumptions made on the day the panels went up.
If you are planning a solar installation or reviewing an existing one, talk to SATEC Australia about the metering points that will give you a complete and defensible view of your energy flows. Contact the team to discuss your site requirements.
FAQs - What Is a Solar Monitoring System and How Does It Improve Solar Self Consumption?
What is the difference between inverter monitoring and a solar monitoring system?
Inverter monitoring reports how much electricity the panels produced. A full monitoring system also measures site consumption, grid import and export, which is what allows self consumption to be calculated.
Why is solar self consumption more valuable than exporting in Australia?
Feed-in tariffs have fallen well below retail electricity rates, and some networks now apply charges to midday exports above a free threshold. Energy used on site avoids the retail rate, so it is generally worth considerably more than the export payment.
Do I need a separate meter if I already have a smart meter?
A retailer smart meter records import and export at the connection point but does not measure solar generation or individual loads. A dedicated meter on the solar circuit is what completes the picture and enables accurate self consumption reporting.
Can monitoring help with the Solar Sharer Offer or similar free power windows?
Yes. Interval data shows exactly how much energy you use inside the free window and whether you are approaching the daily cap, which makes it much easier to decide what to shift and when.
Explore related topics:
For Your Industry
- How Power Monitoring Devices Help Reduce Energy Costs in Commercial Buildings
- How Solar, Batteries And EV Charging Work Within An Embedded Electricity Network
Standards & Compliance
Related Reading
- How To Find Phantom Loads Using Smart Metering Data
- Whole-Building Power Monitoring Devices: What They Are and Why They Matter
Trending in Your Sector


