

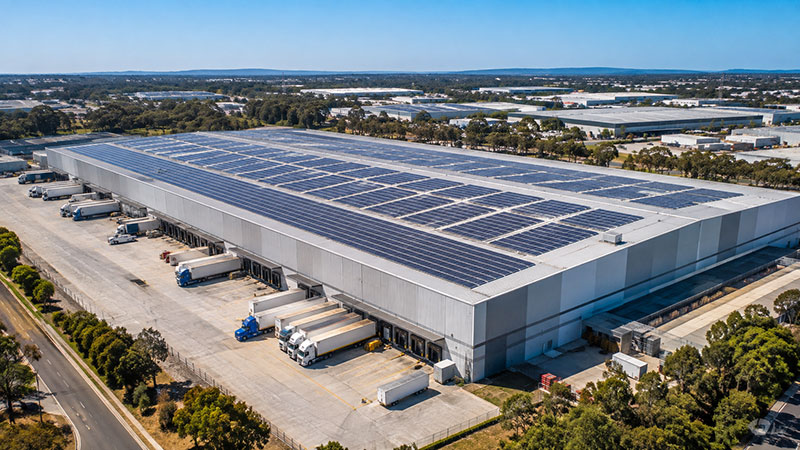
On 5 August 2026, the Federal Government confirmed the Small-scale Renewable Energy Scheme will expand from 100 kW to 1 MW. Commercial, industrial and agricultural sites can install systems ten times larger than the current threshold allows and still receive the upfront discount. Commencement is expected from 1 October 2026, subject to the regulations being finalised.
The gap it targets is real. Australian homes have installed around 22 gigawatts of rooftop solar while businesses have managed only about 5.6 gigawatts, most of it under 100 kW. The 100 kW line has been shaping commercial system design for years and roof space was rarely the reason.
Here is the part that should interest anyone about to sign a proposal. The government’s own worked examples put a 250 kW system at roughly $50,000 a year in electricity savings. Run the arithmetic and that lands at about 14.5 cents per kilowatt hour, which is a retail rate. Those savings only appear if the energy is consumed on site. Export it and the number changes completely.
Key Points
The SRES capacity threshold rises from 100 kW to 1 MW, with commencement expected from 1 October 2026 subject to regulations.
The discount is roughly 20 per cent of upfront cost, working out at about $68,000 on a 250 kW system and $136,000 on a 500 kW system.
The headline savings figures assume energy is consumed on site at retail rates rather than exported, which makes self consumption the critical variable.
Certificate value falls each year as the deeming period shortens towards the scheme’s close in 2030, so timing affects the discount.
Export limits and network connection conditions often influence real payback more than system size does.
SATEC supplies multifunction meters, multi circuit monitoring and the Expertpower platform so generation, consumption and grid interaction can be measured together rather than estimated.
Why Self Consumption Is The Whole Game
The release is careful with its language. It talks about systems “better matching their energy needs” and this is not marketing filler. It is the actual condition on which the savings depend.
A 250 kW system on a retailer producing 345 MWh a year saves around $50,000 if that generation displaces purchased electricity. If a meaningful share is exported instead, the value drops to whatever the feed in arrangement pays, which on commercial tariffs is frequently a fraction of the retail rate.
So the question is no longer how many panels fit on the roof. It is how much of what those panels make will actually be used by the building underneath them.
You cannot answer that from a system proposal. You answer it by measuring the site’s load profile in half hour intervals across a full year and comparing it against modelled generation. Sites with strong daytime demand do well. Cold storage, manufacturing on day shift, supermarkets and data rooms tend to consume most of what they generate. A distribution warehouse that runs lights and a handful of chargers will not.
What Changes When You Go From 100 kW To 1 MW
At 100 kW a business can reasonably run on inverter data. The stakes are modest and nobody is auditing the numbers.
At 850 kW the picture shifts. The government’s example for a system that size puts annual savings at around $175,000. A ten per cent shortfall against modelled performance is $17,500 a year walking out the door, and it will not be obvious from an inverter portal that reports only what the inverter believes it produced.
Larger systems also bring more inverters. AS 4777.2 covers inverters up to 200 kVA each, so a system approaching 1 MW means several units, a more involved connection application and more places for a fault to hide without announcing itself.
Export Limits Deserve More Attention Than They Get
The release commits to improving network connection processes for mid scale projects, which is a quiet acknowledgement that the current process is a bottleneck.
Until that lands, a large rooftop system on a constrained feeder may be approved with a firm export limit or with no export permitted at all. The system still generates. It simply gets curtailed, and depending on how the limit is enforced the inverter portal may show nothing unusual.
Metering at the connection point shows what actually crossed the boundary. Compare that against generation and site load and you can see exactly how much curtailment is happening.
What Should Be Measured
Generation is the obvious starting point although it is rarely enough on its own. Total site consumption tells you what the building needs and when it needs it. Grid import and export at the connection point closes the loop and shows how much of the solar output is genuinely displacing purchased electricity.
Maximum demand belongs in the set as well. Solar only reduces demand charges if it is producing at the moment the peak lands. On a site that peaks at four in the afternoon in February, that assumption needs testing rather than accepting.
Power factor, voltage and harmonics matter more as systems scale. Voltage rise at the point of connection is a known constraint on larger rooftop installations and it is difficult to argue about with a network without measurement to support the case.
Comparing The Monitoring Options
| Approach | What It Measures | Sees Site Load | Suitable For Trade Measurement | Best Use On A Large Solar Site |
|---|---|---|---|---|
| Inverter monitoring portal | Inverter output, equipment status, fault codes | No | No | Equipment health and first line fault diagnosis |
| General purpose multifunction meter | Energy, demand, power factor, basic harmonics | Yes | No | Independent generation and consumption verification |
| NMI approved revenue meter | Energy to trade measurement requirements | Yes | Yes, where pattern approval applies | Connection point measurement and tenant billing |
| Power quality analyser | Voltage, harmonics, flicker, transients, events | Yes | No | Voltage rise investigation and network disputes |
| Multi circuit branch monitoring | Many individual circuits from one device | Yes | Depends on model and application | Multiple inverter feeders, tenancies, board level detail |
Getting The Metering Right With SATEC
Our range covers the measurement points a large rooftop system needs, from generation and site consumption through to the connection point.
Multifunction meters handle energy, demand, power factor and harmonics at switchboard level. Where a site has several inverter feeders or multiple tenancies, multi circuit monitoring measures many individual circuits from a single device, which saves panel space and cuts installation cost against fitting separate meters everywhere. For applications requiring trade measurement, NMI approved options are available.
The PM180 is a power quality instrument so it belongs in fault investigation and network dispute work rather than anywhere near billing. Choosing the right device for the right role avoids an awkward conversation two years later.
Specification depends on site design, accuracy class, communications architecture and what the data is ultimately for. Any scheme specific measurement requirements should be confirmed during project design rather than after commissioning.
Turning Measurement Into Decisions
Meters produce numbers. Numbers by themselves change nothing.
Expertpower brings metering data into one platform where generation, consumption, demand and power quality sit together and can be compared over time. That comparison is where the value is. Seeing that solar covered 62 per cent of site load in October but only 41 per cent in January tells a facility manager something they can act on.
For organisations with several sites, portfolio comparison makes an underperforming system visible in weeks rather than hiding it inside a monthly bill. The platform also shows how solar interacts with batteries, EV charging, HVAC and process loads, which matters as sites stack more than one technology on the same connection.
Timing And What To Do Before October
Two dates shape the decision. Commencement is expected from 1 October 2026, so systems installed before then fall under the current 100 kW cap. And certificate value declines each year as the deeming period shortens towards the scheme’s close in 2030, meaning a system installed in 2027 attracts a smaller discount than the same system installed this October.
That leaves roughly seven weeks to get the preparatory work done. Establish the baseline now. Measure the existing load profile at interval level before any panels go up, because comparing performance against properly measured pre solar data is far more convincing than comparing it against a recollection of last year’s bills.
One detail to watch in the regulations. The SRES has carried an annual output cap alongside the capacity cap, and the government’s own 850 kW example produces well beyond it. Whether that cap lifts, changes or disappears has not been confirmed and it will matter for high utilisation industrial sites.
Planning a commercial solar system ahead of the October threshold change? Talk to SATEC Australia about baseline measurement, meter selection and Expertpower monitoring before the roof work starts.
FAQs - Commercial Solar Metering: What The 1 MW SRES Change Means
When does the 1 MW threshold take effect?
The expanded Small-scale Renewable Energy Scheme is expected to commence from 1 October 2026, subject to the necessary regulations being in place. Systems installed before that date remain under the existing 100 kW cap. Confirm current status with the Clean Energy Regulator before committing to a project timeline.
Does a commercial solar system need its own meter separate from the retailer’s meter?
The retailer’s meter measures energy at the connection point only, so it cannot show how much solar was generated or how much was consumed on site. A separate generation meter is needed for that visibility. Most larger sites end up metering generation, consumption and the connection point.
Will solar actually deliver the savings quoted in the announcement?
Those figures assume the electricity is consumed on site rather than exported, because they are based on retail electricity rates. Sites with strong daytime demand will get close to them while sites that export heavily will not. Measuring your load profile before installation is the only reliable way to know which category you fall into.
What is voltage rise and why does it matter on a large rooftop system?
Exporting power to the grid pushes voltage upward at the point of connection, and if it exceeds limits the inverters reduce output or disconnect to protect themselves. On larger systems this can cause real production loss that looks like an equipment fault. Power quality monitoring identifies whether voltage rise is the actual cause.
Explore related topics:
For Your Industry
Standards & Compliance
- LGC Billing Accuracy: Essential Metering Solutions for 100kW+ Solar Compliance
- Commercial Solar Power Metering Solutions: Optimising Billing & Grid Compliance
Related Reading
- Solar Net Metering Explained: How It Works and Why Accurate Metering Matters
- What Is a Solar Monitoring System and How Does It Improve Solar Self Consumption?
Trending in Your Sector


