

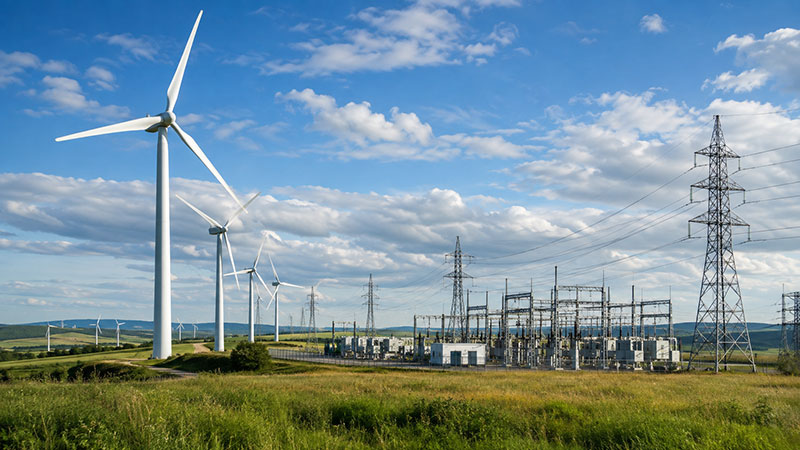
Wind now carries a serious share of the National Electricity Market (NEM). That shift has changed what network businesses ask of generators. It has also changed what happens when something goes wrong.
Modern wind turbines connect through power electronic converters rather than directly through rotating machines. Those converters are what make variable speed operation possible. They are also what make wind farms electrically complicated. The waveform arriving at the point of connection is not simply a scaled version of what the rotor produced. It has been shaped by switching devices, filters, transformers and a collection network that may run for tens of kilometres.
Power quality is where all of that becomes visible. Get it right and the wind farm operates inside its performance standards without argument. Get it wrong and the operator finds out through curtailment, connection disputes or equipment that fails earlier than it should.
Key Points
Australian wind farms are held to negotiated generator performance standards under Schedule 5.2 of the National Electricity Rules, with harmonic and flicker limits allocated during the connection process.
Converter switching is the dominant source of harmonic emission at a modern wind farm and the effect compounds across a shared collection network.
Voltage sags, swells and ride through behaviour matter more in Australia than in most markets because of long radial lines and areas of low system strength.
System strength has overtaken inertia as the practical constraint on how much converter based generation a region can host.
Periodic testing cannot describe a plant whose output changes minute to minute, which is why continuous Class A measurement has become the expected baseline.
SATEC power quality instruments combined with the Expertpower platform give wind farm operators a continuous, time stamped record across the site rather than a set of disconnected local readings.
What Does Wind Farm Power Quality Mean?
Power quality describes how closely voltage, frequency and waveform shape match what connected equipment and the network expect. At a wind farm those conditions move constantly. Output rises and falls with wind speed. Converters respond. Transformers and cables react to both.
A wind turbine does not produce a fixed quantity of electricity and it never has. What has changed is the machinery sitting between the rotor and the grid. Type 3 doubly fed machines and Type 4 full converter machines dominate new Australian projects. Both introduce switching behaviour that a synchronous generator simply does not produce.
Good power quality means voltage stays within its allocated envelope, harmonic distortion sits inside the limits agreed at connection and frequency response behaves the way the performance standard says it will. It also means disturbances are captured with enough detail that someone can explain them afterwards.
Harmonics and Converter Behaviour
Harmonics are distortions of the fundamental waveform. In wind generation they come overwhelmingly from converter switching, though transformer saturation and network resonance contribute as well.
The interesting part is not the individual turbine. It is the aggregation. A wind farm with sixty machines feeding a shared 33 kV collection network is sixty harmonic sources connected to a substantial amount of cable capacitance. That combination can create resonance at frequencies nobody predicted during design. Emission that looked trivial at one turbine terminal can become a compliance problem at the point of connection.
Excessive harmonic levels contribute to additional heating in transformers and cables. They cause nuisance operation of protection and they increase losses across the plant. Where capacitor banks or long cable runs create a resonant condition, particular orders can be amplified rather than damped.
In Australia the emission limits themselves are allocated during the connection process under AS 61000.3.6. That allocation is negotiated. Demonstrating compliance against it requires measurement that meets the harmonic measurement requirements of IEC 61000-4-7, aggregated the way the standards intend.
Continuous measurement is what separates a recurring resonance from a one off event. Without it an operator is guessing.
Voltage Variation, Flicker and Ride Through
Wind conditions change and output changes with them. Control systems manage most of that. Voltage fluctuation still occurs.
Variation arises from turbine starting and stopping, reactive power adjustment, network switching and faults either inside the wind farm or out on the transmission system. Repeated variation produces flicker, assessed in Australia against the emission limits in AS 61000.3.7.
More severe events matter more. A voltage sag during a transmission fault will propagate through the collection network and reach every turbine. How the plant behaves during that sag is not optional. It is written into the generator performance standard under S5.2.5.4 and it is tested.
Australia learned this the hard way. During the South Australian black system event of September 2016, nine of thirteen wind farms in the state reduced output after voltage ride through protection activated. The reduction totalled roughly 456 MW and it happened after six voltage disturbances in the space of about two minutes. The protection settings were doing exactly what they had been configured to do. The configuration was the problem.
That event reshaped how Australian network businesses treat ride through settings and it explains why detailed, time stamped disturbance records are now treated as evidence rather than diagnostics. If a plant cannot show what it saw and how it responded, the conversation becomes considerably harder.
System Strength and Grid Stability
Inertia gets most of the attention in public discussion. System strength is the more immediate operational constraint.
Synchronous generators provide a strong voltage reference that converters use to remain stable. Remove enough of them and converter control systems can begin interacting with each other and with the network in ways that produce oscillation rather than damping. West Murray demonstrated this in the Victorian and New South Wales border region, where inverter based plants were curtailed while control interactions were resolved.
The AEMC’s system strength framework now places obligations on transmission network service providers to plan for and provide adequate system strength, with connecting generators required to remediate their own contribution. That has practical consequences. Sub-synchronous control interaction is no longer a theoretical concern in weak parts of the NEM. It is something a connection study must address and something monitoring should be able to detect.
Wind farms can and do support stability. Modern controls provide fast reactive power response and can be tuned to assist during disturbances. The difficulty is knowing how those controls actually behave rather than how they were modelled.
Why Continuous Monitoring Beats Periodic Testing
A periodic survey gives a snapshot. A wind farm operating at 15 per cent capacity factor on a still afternoon bears little electrical resemblance to the same plant at full output during a network disturbance.
Continuous measurement produces a record instead of a sample. Events can be correlated against turbine output, switching operations and network conditions. Trends become visible, and a slow drift in harmonic emission that signals a failing filter or a degrading converter can be spotted before it becomes a compliance notice.
There is a commercial dimension too. Curtailment disputes, connection compliance questions and warranty claims all turn on evidence. The operator with a continuous, synchronised record is in a materially stronger position than the operator with a two week survey from eighteen months ago.
Wind Farm Power Quality Parameters and Where They Bite
| Parameter | Typical Wind Farm Source | Australian Reference Point | What Monitoring Must Capture |
|---|---|---|---|
| Harmonic distortion | Converter switching, network resonance across the collection system | AS 61000.3.6 emission limits allocated at connection | Individual orders and THD, aggregated to IEC 61000-4-7 intervals |
| Voltage fluctuation and flicker | Output variation, turbine starting and stopping, reactive power adjustment | AS 61000.3.7 emission limits | Short term and long term flicker severity to IEC 61000-4-15 |
| Voltage sags and swells | Transmission and collection network faults, switching operations | Generator performance standard S5.2.5.4 | Magnitude, duration and phase detail with sub-cycle time stamping |
| Voltage unbalance | Untransposed lines, unbalanced network conditions | AS 61000.3.13 | Negative sequence component measured continuously |
| Frequency deviation and RoCoF | System events, contingency separation | Frequency Operating Standards and S5.2.5.3 | High resolution frequency trend and plant response |
| Sub-synchronous oscillation | Converter control interaction in low system strength areas | Connection studies and the system strength framework | Waveform capture at sufficient resolution to reveal the oscillation |
SATEC Instruments for Wind Farm Power Quality
Wind farms need measurement that stands up to scrutiny from a network business. That means Class A compliance under IEC 61000-4-30, accurate time synchronisation and the ability to capture a disturbance in full rather than summarising it away.
The PM180 was designed for exactly this role. It performs continuous Class A power quality measurement alongside high resolution transient and disturbance recording, which is what allows an engineer to reconstruct an event rather than infer it. Deployment across turbine connection points, collector substations, transformers and the point of connection builds a picture of where a disturbance originated and how far it travelled.
One point deserves to be stated plainly rather than buried. The PM180 is a power quality and monitoring instrument. It is not NMI pattern approved so it cannot be used for revenue metering in the NEM. Any settlement metering installation remains a separate compliance pathway with its own approved devices.
Expertpower brings the measurement data from across a site into one platform. Trends can be reviewed across the whole wind farm instead of meter by meter, and disturbance records from multiple locations can be lined up against a single event. For a plant spread over several thousand hectares, that central view is the difference between investigating a problem and merely noticing it.
Building a Clearer Picture of Wind Farm Performance
As wind generation grows the interaction between turbines and the network becomes harder to model and easier to get wrong. Harmonics, voltage behaviour and stability are not separate topics. They are the same converter control systems observed through different measurements.
Australian conditions sharpen all of it. Long radial connections, regions of genuinely low system strength and a regulatory framework that negotiates limits plant by plant mean that generic assumptions travel poorly here. What works at a wind farm in northern Europe may not survive contact with the Murray River corridor.
Reliable power quality data changes the nature of the conversation. It turns compliance from an annual anxiety into a continuous position, and it gives technical teams something concrete to work with when a network business asks what happened at 14:37 last Tuesday.
Talk to Us About Your Connection Point
If you are commissioning a wind farm, negotiating a performance standard or trying to explain a disturbance that nobody recorded properly, we can help you work out what needs measuring and where. Get in touch with the SATEC team for a discussion about power quality monitoring for your site.
FAQs - Wind Farm Power Quality
Do Australian wind farms have to monitor power quality continuously?
Continuous monitoring is not universally mandated in the Rules, though generator performance standards agreed at connection frequently require ongoing demonstration of compliance. In practice most network businesses expect Class A measurement at the point of connection. Continuous data is also what protects an operator during a curtailment or compliance dispute.
What causes harmonics at a wind farm?
The main source is switching within the power electronic converters that every modern turbine relies on. Transformer saturation and resonance between cable capacitance and network inductance add to the picture. Because a wind farm has many converters feeding a shared collection network, the aggregate emission at the point of connection can be considerably worse than any single turbine suggests.
How does low system strength affect a wind farm?
Converters need a stable voltage reference to remain well damped. Where synchronous generation is sparse that reference weakens and control systems can begin interacting with each other, producing oscillation instead of stability. This has led to real curtailment in parts of the NEM and it is why system strength now sits at the centre of connection assessment.
Can the PM180 be used for settlement metering at a wind farm?
No. The PM180 is a power quality analyser and disturbance recorder, not an NMI pattern approved revenue meter. Settlement metering in the NEM requires an approved metering installation, which is a separate exercise from power quality monitoring even though both may sit at the same connection point.
Explore related topics:
For Your Industry
Standards & Compliance
- What Does an EN50160 Power Quality Report Actually Tell You?
- Wide Area Monitoring System (WAMS) with IEEE C37.118 Compliant PMUs
Related Reading
- How Electrical Harmonics Are Generated And Why They Should Be Regularly Monitored
- What Causes Voltage Dips in Australian Facilities?
Trending in Your Sector


