

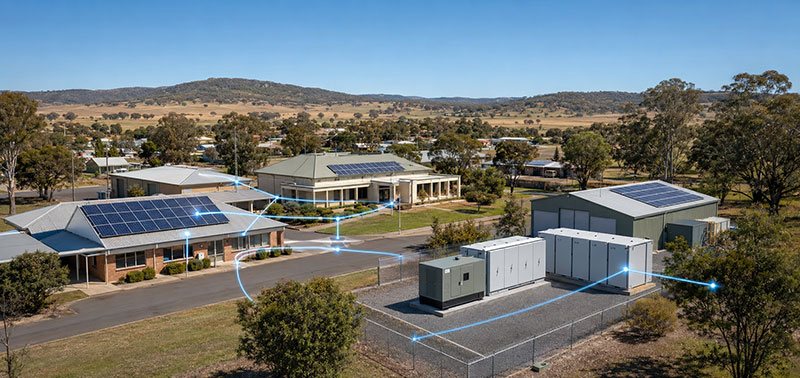
Regional microgrids are moving from feasibility study to switchboard. Councils managing remote towns, water treatment plants and evacuation centres are combining solar, battery storage, backup generation and a grid connection into something they can actually control. Some of these systems can island when the network fails.
That control depends entirely on measurement. Without dependable data, an operator cannot say how much energy each asset produced, stored or consumed. They certainly cannot say whether enough energy remains to keep the pumps running through a third day of outage.
Here is the part that gets uncomfortable. The metering budget is usually the first line trimmed when a microgrid business case tightens. It is also the decision councils most often regret two winters later, when a funding body asks for evidence and nobody can produce it.
Key Points
A microgrid moves power in several directions at once, so a single meter at the grid connection cannot explain what happens behind it.
Australian microgrids that supply multiple customers fall under the stand-alone power system framework, which brings metering obligations many councils do not anticipate.
Where electricity is billed or traded, the meter must hold NMI pattern approval under NMI M 6-1.
Battery performance claims should be verified independently rather than accepted from the battery management system alone.
Power quality matters as much as energy during islanding, reconnection and sudden load changes.
SATEC supplies NMI approved meters, multi circuit monitors and Class A power quality analysers covering the full microgrid architecture, with data feeding into Expertpower.
Regional Microgrids Move Power In Several Directions
A conventional council depot takes electricity through one connection. Power arrives. Power is consumed. The bill reflects it.
A microgrid behaves nothing like that. Solar may supply the administration building while surplus energy charges the battery. When cloud cover arrives the battery supports the site until the grid or a generator picks up the shortfall. Later that evening the flow reverses again.
Where To Place Measurement Points
Each of those movements needs measuring separately. A meter at the grid connection reports total import and export yet stays silent about everything behind it. Effective microgrid metering places measurement points at the connection, at each generation asset, at the battery, at the backup generator and at the loads that matter most.
The result is an energy balance. You can see where electricity originated, where it went and what disappeared during conversion or storage. Estimates get replaced by numbers.
The Australian Regulatory Layer Councils Often Miss
This is where Australian projects diverge from the international literature. Under the national framework, a stand-alone power system supplying multiple customers is treated as a microgrid, and distributor-led systems can now be delivered within the National Electricity Market. Each generating unit in a regulated stand-alone power system requires its own connection point. Metering data for those units is calculated through defined procedures that account for losses within the system.
Practically, that means the measurement architecture is not purely an engineering choice. It has a settlement dimension.
Then there is trade measurement. Any meter used to bill or sell electricity in Australia must hold NMI pattern approval under NMI M 6-1. Councils selling energy to a community organisation, a caravan park or a commercial partner sit inside that requirement whether or not they intended to. Retrofitting compliant meters after commissioning is expensive and awkward. Specifying them at design stage costs very little more.
Funding has followed the same direction. The Australian Renewable Energy Agency’s Regional Microgrids Program holds up to $125 million, split across a $50 million innovation and resilience stream and a $75 million First Nations community stream. Victoria committed $9.85 million to its Community Microgrids and Sustainable Energy Program after the 2019/20 Black Summer fires, with projects at Corryong, Mallacoota and Omeo. Funded projects come with reporting expectations, and reporting expectations come back to metering.
Keeping Supply And Demand Balanced
When a microgrid operates independently, supply and demand must match continuously. The energy management system decides when to draw on solar, when to charge or discharge the battery and when to start a generator. Every one of those decisions rests on measured inputs.
Small errors compound quickly. An overstated state of charge can mean a generator starts too late. An understated load can mean the reserve you thought you had was never there. Neither failure announces itself until the moment it matters.
Interval data also reveals patterns that assumptions miss. A coastal town on the NSW South Coast triples in population over the Christmas period. An agricultural centre in the Riverina peaks with irrigation pumping in February. A snowfields community loads up in July. Sizing a microgrid on annual averages ignores all of it.
Protecting Critical Community Services
Resilience is usually the reason a council starts investigating a microgrid at all. Bushfires, floods, cyclones and storm damage regularly leave regional communities without supply for days. Once islanded, the energy inside the microgrid is finite and must be rationed deliberately.
Accurate metering shows exactly what the water pumps, the wastewater plant, the emergency operations centre, the telecommunications hut and the community shelter are drawing. Operators can protect those loads and shed the rest. Without per circuit visibility, load shedding becomes guesswork with a switchboard.
After the event, the data earns its keep a second time. How long did the battery actually support the site? How much diesel did the generator burn? Which loads were larger than anyone expected? Those answers improve the next emergency plan and strengthen the next funding submission.
Verifying What The Battery Actually Delivers
Battery storage is often the single largest capital item in the project. Its management system will report state of charge and cycle counts quite happily. Independent measurement is what confirms whether those reports reflect reality.
Metering compares energy in against energy later returned. That comparison exposes round trip efficiency, conversion losses and gradual performance decline. It can also reveal operating patterns that accelerate degradation, which is worth knowing while the warranty is still live.
Measurement may be needed on the AC side, the DC side or both. A DC coupled solar and battery installation behind a single connection point needs DC measurement to separate generation from storage. The meter chosen has to suit the electrical architecture rather than the other way around.
Power Quality Deserves Equal Attention
A microgrid must supply energy of adequate quality, not merely adequate quantity. Solar inverters, battery converters, generators, borefield pumps and variable speed drives all shape voltage and current waveforms.
The vulnerable moments are predictable. Transitioning to island mode. Reconnecting to the network. Large motors starting on a system with limited fault level. Power quality monitoring captures voltage variations, frequency deviations, harmonics, unbalance, flicker and interruptions across those transitions.
Basic energy meters will not see any of this. Where a microgrid has an islanding boundary, a proper analyser at that point is not optional. It is the only instrument that can tell you why the transition failed.
Choosing The Right Meter For Each Measurement Point
| Measurement Point | What It Reveals | Accuracy Or Approval Needed | Suitable SATEC Device |
|---|---|---|---|
| Grid connection point | Total import and export, demand peaks, tariff exposure | NMI pattern approved under NMI M 6-1 where energy is billed or traded, Class 0.5S | EM133-XM |
| Solar generation | Actual yield against forecast, inverter availability | Revenue grade where funding or certificate claims apply | EM133-XM |
| Battery AC side | Round trip efficiency, charge and discharge behaviour | Class 0.5S or better with interval logging | EM133-XM or PM335 / EM235 PRO |
| Battery DC side | DC yield, conversion losses, separation of generation from storage | Direct DC measurement to 820V DC, higher via adapter | PM335 or EM235 PRO |
| Backup generator | Run hours, loading profile, fuel efficiency | Standard energy metering with event logging | EM133-XM |
| Switchboard with many feeders | Per circuit consumption for buildings and essential services | NMI approved multi circuit metering where participants are billed | BFM136 |
| Islanding boundary or point of common coupling | Voltage dips, frequency deviations, harmonics, flicker during transition | IEC 61000-4-30 Class A or Class S | PM335 or EM235 PRO, PM180 for Class A forensic work |
SATEC Metering For Australian Regional Microgrids
The EM133-XM covers the workhorse positions. It is a DIN rail meter with NMI pattern approval, Class 0.5S accuracy, 8MB of onboard logging for interval data and a choice of RS-485 or Ethernet. A retrofit variant using split core sensors lets installers add measurement without de-energising existing circuits, which matters when the switchboard feeds a water treatment plant.
Where a switchboard carries many feeders, the BFM136 handles up to twelve three-phase channels or thirty six single-phase channels from one device. It remains the only multi circuit monitor approved under NMI M 6-1 for billing in Australia. Councils can meter every building, pump station and controlled load without a full sized meter for each one.
For the islanding boundary, the PRO Series steps in. Available as PM335 panel mount or EM235 DIN rail, it delivers IEC 61000-4-30 Edition 3.1 power quality analysis in Class A or Class S, EN 50160 reporting, waveform capture and combined AC and DC measurement in a single device.
That last capability is genuinely useful because it lets one instrument cover both the AC connection and the DC side of a coupled solar and battery installation. AEMO FCAS compliant models exist within the same series for projects contemplating market participation.
Where forensic depth is needed, the PM180 provides Class A Edition 3 analysis with an integrated digital fault recorder. It is the instrument to reach for when an islanding transition fails and the post incident review needs evidence rather than opinion.
Data from all of these devices feeds into Expertpower for centralised dashboards, alarms, reporting and historical analysis. Open protocols including Modbus, DNP3, IEC 60870-5-104 and IEC 61850 mean the same metering data can serve third-party control and energy management systems without duplication.
Turning Reliable Data Into Better Decisions
Good microgrid metering delivers more than a consumption record. It provides the visibility to run the system, the evidence to protect essential services and the proof that each asset performs as promised.
Historical measurement then guides what comes next. Whether that is more solar, a second battery, EV charging for the council fleet or a new community facility, measured data beats assumption every time.
If your council or community is scoping a regional microgrid, the measurement architecture is worth settling before the switchboard is ordered. Talk to the SATEC Australia team about where to place meters, which points need NMI pattern approval and where Class A power quality monitoring earns its cost. Contact us to arrange a design review.
FAQs - Why Accurate Energy Metering Is Essential For Regional Microgrids
Does every meter in a microgrid need NMI pattern approval?
No. Approval under NMI M 6-1 is required only where electricity is sold, billed or otherwise traded, though many operators specify approved meters at key points anyway to keep future options open.
Can one meter cover both the AC and DC sides of a battery?
Yes. The SATEC PRO Series measures AC and DC in a single device, with direct DC voltage measurement to 820V and DC current via U-HACS or Hall Effect sensors.
What is the difference between Class A and Class S power quality monitoring?
Class A carries tighter measurement uncertainty and is the appropriate choice for compliance evidence and dispute resolution, while Class S suits general monitoring and trend analysis at a lower cost.
How often should microgrid interval data be recorded?
Five minute intervals are the practical standard for Australian applications, matching settlement arrangements and giving enough resolution to see islanding events and demand peaks clearly.
Explore related topics:
Standards & Compliance
- Why Choosing the Right Electricity Sub Meter Matters for Accurate Billing
- Solar Net Metering Explained: How It Works and Why Accurate Metering Matters
Related Reading
- Why DC Energy Monitoring Is Key to Electrification and Behind-the-Meter Systems
- True RMS vs Average-Responding Meters: Why Your Readings Don’t Match on Modern Loads
Trending in Your Sector


