

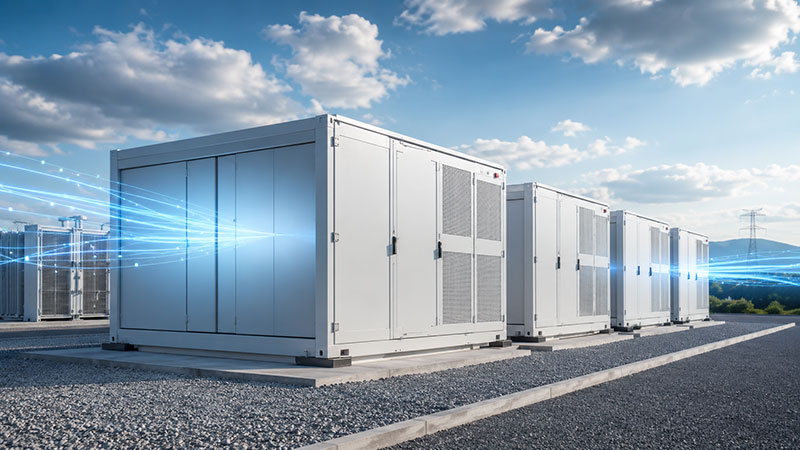
Battery Energy Storage Systems (BESS) are usually described by their power rating and their storage capacity. Those two figures explain how much power a system can deliver and how much energy it can hold. Neither figure tells you how much of the energy used to charge the battery will actually be available when the system discharges.
That is the job of battery round-trip efficiency. Battery round-trip efficiency measures the relationship between the energy supplied to a battery during charging and the energy returned during discharge. It gives a practical indication of how effectively a system stores and releases energy.
No battery returns every kilowatt hour it receives. Energy is lost in the cells, cables, power electronics, transformers, cooling equipment and other supporting systems. Accurate measurement helps asset owners understand those losses and decide whether the system is performing as expected.
Key Points
Battery round-trip efficiency is the percentage of charging energy that can be recovered when the battery discharges.
The measurement boundary changes the answer, because cell level, DC and AC boundaries capture different losses.
Energy is lost in the cells, the power conversion system, transformers, cabling and auxiliary loads such as cooling.
Australian summer heat drives auxiliary consumption up, which reduces the efficiency measured at the AC connection point.
Reliable results need bidirectional measurement, matched states of charge, short intervals and synchronised timestamps.
SATEC PRO Series energy meters support accurate AC and DC energy measurement and Expertpower brings the data together for efficiency analysis over time.
What Is Battery Round-Trip Efficiency?
Battery round-trip efficiency is the percentage of charging energy that can be recovered when the battery discharges. The basic calculation is:
Battery round-trip efficiency = energy discharged ÷ energy charged × 100
Consider a battery that receives 1,000 kWh during charging. If it later delivers 900 kWh during discharge the round-trip efficiency is 90%.
The missing 100 kWh has not disappeared through a single fault. It represents the combined losses that occurred during charging, storage and discharge.
A higher efficiency means more of the purchased or generated energy is available later. A lower figure may point to excessive conversion losses, high auxiliary consumption, poor operating conditions or declining battery performance.
Why Round-Trip Efficiency Matters In The NEM
Battery projects are developed to reduce peak demand, shift renewable generation, provide network services or improve energy resilience. The financial value of those activities depends partly on how much stored energy can be recovered.
Australian market conditions make that point clearly. Energy arbitrage accounted for 97% of estimated grid-scale battery revenue in the NEM in Q1 2026, at $93.9 million out of $96.9 million. Frequency Control Ancillary Services (FCAS) contributed only 3%. Arbitrage is now the dominant revenue stream for most operators.
Arbitrage margins are also tightening. The NEM-wide battery price spread fell from $183/MWh in Q1 2025 to $121/MWh in Q1 2026. When the gap between charging cost and discharge value narrows, lost energy takes a larger bite out of the remaining margin. A battery that quietly returns two percentage points less than expected is giving away real revenue every day.
Efficiency also affects renewable projects. A solar farm may send excess generation into a battery during the day. Every conversion or storage loss reduces the amount of renewable energy that can be delivered later.
For owners of commercial and utility scale systems the figure influences revenue forecasts, operating costs, warranty assessments and project performance guarantees.
The Measurement Boundary Changes The Result
One of the most important parts of battery efficiency analysis is deciding where energy will be measured.
Battery round-trip efficiency can be measured across the cells, the DC system or the entire AC connected installation. Each boundary produces a different result.
Cell Level Efficiency
This focuses on energy entering and leaving the battery cells. The figure often looks high because it excludes many external losses.
DC To DC Efficiency
This can include the battery modules, the battery management system and some DC equipment. Cabling and protection losses may also be included depending on where the meters sit.
AC To AC Efficiency
This measures energy entering the complete system from the AC network and energy returned to the network. It is usually the most useful figure for asset owners because it reflects the performance of the full installation.
An AC boundary may include the inverter, the power conversion system, the transformer and battery auxiliaries. It gives a realistic view of the energy that was purchased or generated compared with the energy that was actually recovered.
Comparison Of Measurement Boundaries
| Measurement Boundary | What It Measures | Losses Included | Losses Excluded | Typical Meter Placement | Best Used For |
|---|---|---|---|---|---|
| Cell Level | Energy in and out of the battery cells | Internal cell resistance and thermal losses | Conversion, transformer, cabling and auxiliary losses | Within the battery management system | Cell and module performance assessment |
| DC To DC | Energy in and out of the battery on the DC side | Cell losses plus battery management and some DC cabling and protection losses | Inverter, transformer and most auxiliary losses | Between the battery and the power conversion system | Separating battery losses from conversion losses |
| AC To AC (Auxiliaries Excluded) | Energy at the AC connection to the battery system | Cell, conversion, transformer and cabling losses | Cooling, controls and other auxiliaries supplied from a separate circuit | At the AC side of the power conversion system | Assessing the conversion and battery chain |
| AC To AC (Auxiliaries Included) | Energy at the full system connection point | All of the above plus cooling, heating, controls, communications and fire protection | Very little | At the point of connection | Commercial performance, revenue analysis and warranty discussions |
Where Does Battery Energy Get Lost?
Losses occur at several points in a battery energy storage system.
The cells generate heat as they charge and discharge. Internal resistance creates losses that increase at high charging rates, low states of charge or unfavourable temperatures.
The power conversion system also consumes energy. Batteries store and release DC electricity while sites and networks operate in AC. Converting power from AC to DC during charging and from DC to AC during discharge creates losses.
Transformers, cables, busbars and protection equipment add further losses. Each one may be small although the combined effect becomes significant across repeated cycles.
Battery systems also use energy for cooling, heating, controls, communications, fire protection and battery management. These auxiliary loads can operate even when the battery is neither charging nor discharging.
Australian Operating Conditions Affect The Result
Published efficiency figures are measured under defined test conditions. Australian sites rarely operate under those conditions.
Heat is the obvious difference. Batteries deployed across Queensland, New South Wales, Victoria and South Australia face long stretches of high ambient temperature during summer. Cooling systems work harder during exactly the periods when the battery is cycling hardest. That auxiliary consumption sits inside the AC measurement boundary at most sites.
Market design matters as well. The NEM has operated under five minute settlement since October 2021. Dispatch and price signals move quickly and batteries respond in kind. Measurement intervals that are too coarse will smooth over the charge and discharge behaviour you are trying to analyse.
Battery performance also changes with charging power, discharge power, depth of discharge and age. A system running at low power carries a higher proportion of fixed auxiliary losses.
A system running near its maximum rating experiences greater electrical and thermal losses. The measurement period affects the answer too. Comparing one charging event with an unrelated discharge event produces a misleading figure. The state of charge at the start and end of the period should be similar.
Reliable analysis needs consistent boundaries, synchronised data and clear rules for matching charging energy with discharged energy.
How To Measure Battery Round-Trip Efficiency Accurately
A practical AC to AC calculation requires a bidirectional electricity meter at the point of connection. The meter must record imported energy during charging separately from exported energy during discharge.
For deeper analysis a second meter can sit on the DC side between the battery and the power conversion system. Comparing AC and DC data shows whether losses are occurring inside the battery or inside the conversion equipment.
Measurement intervals should be short enough to capture real charging and discharging behaviour. Accurate timestamps are essential when data from several meters is compared.
Auxiliary loads need careful thought. If cooling and control equipment sits behind the main battery meter its consumption is included in the overall result. If it is supplied from elsewhere it may need separate measurement.
One point of clarity helps here. Market settlement metering at a NEM connection point is provided through an approved metering installation arranged by the Metering Coordinator. Performance metering is a separate layer that the asset owner controls. Both have a role. The performance layer is where efficiency analysis actually happens, because it can be placed exactly where the engineering question sits.
Registration also changed under the AEMC’s Integrating Energy Storage Systems rule, which commenced in June 2024 and introduced the bidirectional unit classification. Storage is now treated as a two-way asset in the rules. Measuring it as a two-way asset is the logical next step.
How SATEC Supports Battery Efficiency Measurement
Accurate measurement of both AC and DC battery energy is well within the capability of the SATEC PRO Series (EM235 and PM335).
A bidirectional meter installed at the AC connection point records the energy consumed while charging and the energy exported while discharging. Separate import and export registers provide the two values needed for the AC to AC calculation.
The PM335 PRO and EM235 PRO suit advanced energy monitoring applications where accurate bidirectional measurement, detailed data logging and flexible communications are required. Both models offer Class 0.2S energy accuracy along with Class A power quality analysis to IEC 61000-4-30 Ed. 3.1, so a single device covers energy performance and power quality investigation.
The PM335 PRO is panel mounted while the EM235 PRO is DIN rail mounted, which gives designers a choice without changing the measurement capability.
DC measurement is supported directly. Meters can be configured for the DC side between the battery and the power conversion system, which lets operators compare battery side energy with AC side energy and isolate conversion losses.
Voltage measurement accessories and current shunts are selected to match the electrical design of the battery system. For higher DC voltages a VRM module extends the connection range well beyond the standard meter rating.
Communications options include Modbus, DNP3, IEC 61850 and dual port Ethernet, which simplifies integration with existing site SCADA or control systems.
Energy meter data can then be collected and analysed in Expertpower. Centralised visibility helps operators review charging cycles, discharge performance, energy balances and efficiency trends over time. That view becomes especially valuable when performance must be assessed across different operating conditions or compared against project expectations.
With 50-plus years of experience in power measurement, SATEC brings a metering approach built around accuracy and long-term data quality rather than snapshot readings.
Turning Efficiency Data Into Better Decisions
A single efficiency percentage is a useful snapshot. The greater value comes from watching how that percentage changes.
A gradual decline may indicate ageing. A sudden change may point to an inverter issue, a cooling problem, a meter configuration error or an operational change. Comparing efficiency at different power levels reveals whether the battery is running inside its most efficient range.
Accurate data gives owners a stronger basis for verifying performance claims, investigating losses and improving operating strategies. It also supports clearer conversations with suppliers, integrators and maintenance providers, because everyone is looking at the same measured numbers rather than a datasheet.
FAQs - Battery Round-Trip Efficiency Explained: Where Stored Energy Is Lost
What is a normal round-trip efficiency for a battery energy storage system?
It depends entirely on where the measurement is taken, since cell level figures are always higher than figures measured at the AC connection point. Always ask which boundary a quoted figure refers to before comparing systems.
Why is my measured efficiency lower than the manufacturer’s figure?
Published figures come from controlled test conditions that a working Australian site rarely matches. Ambient heat, auxiliary loads, partial load operation and battery age all reduce the result.
Do auxiliary loads need to be included in the calculation?
If cooling and control equipment is supplied behind the main battery meter then its consumption is already included in the AC to AC result. If it is fed from a separate circuit it should be measured separately so the figure remains honest.
How often should round-trip efficiency be reviewed?
Continuous logging with a monthly or quarterly review works well for most commercial assets. Trends over time reveal far more than any single measurement.
Explore related topics:
Standards & Compliance
Related Reading
- Battery Energy Storage Systems (BESS): The DC Metering Checklist
- Can a DC Meter Support Battery Storage Monitoring?
- DC Energy Metering Solutions for Solar Battery Storage & Microgrids: Advanced Monitoring Technology for Renewable Energy Systems
Trending in Your Sector


