Most buildings use electricity even when no one is actively doing anything. Lights may be off, staff may have gone home and production may have stopped for the day. Yet somewhere in the background, equipment is still drawing power. This hidden consumption is commonly called a phantom load.
Phantom loads are also known as ghost loads, idle loads, standby loads, vampire loads, parasitic loads and background loads. The terms differ slightly but they all point to the same problem: electricity being used when equipment appears to be switched off, inactive or not delivering useful work.
In Australian homes, phantom loads are often linked to televisions, chargers, microwaves and appliances left in standby mode. In commercial buildings, the issue can be much larger. Office equipment, control systems, pumps, signage, access systems, servers, HVAC components, EV chargers, vending machines and production equipment can all continue drawing power when a site looks inactive.
Key Points
Phantom loads are electricity drawn by equipment that appears switched off or inactive, and they are surprisingly common across Australian commercial buildings.
Commercial buildings account for around 25% of overall electricity use and 10% of total carbon emissions in Australia, making hidden waste a significant national issue.
Smart metering data reveals when and where energy is being used, replacing guesswork with measurable evidence.
Comparing overnight, weekend and shutdown consumption periods is one of the most effective ways to identify phantom loads.
Submetering breaks a site into meaningful zones, helping teams pinpoint which area or circuit is responsible for unexplained background consumption.
SATEC’s NMI-approved meters and Expertpower software give Australian facilities the data visibility they need to find, reduce and verify savings from phantom loads.
Why Phantom Loads Matter In Australia
Phantom loads may seem small in isolation. A single standby device may not appear to justify much attention. Across a commercial site, however, small loads add up quickly. The problem becomes even more significant when those loads continue 24 hours a day, seven days a week.
A load that runs continuously does not need to be large to become expensive. A few unnecessary kilowatts left running overnight can create a noticeable cost over weeks, months and years. For organisations managing multiple sites across Australia, the cumulative impact can be substantial. There is also an emissions angle. According to DCCEEW, commercial buildings are responsible for around 25% of overall electricity use and 10% of total carbon emissions in Australia. Energy that is used without purpose still contributes directly to a building’s carbon footprint.
For asset owners, facility managers and businesses working towards NABERS ratings or other sustainability targets, reducing avoidable consumption is one of the most practical first steps. The difficulty is knowing what to act on. Without detailed data, teams often rely on assumptions. Smart metering replaces assumptions with evidence.
What Smart Metering Data Can Reveal
Traditional utility bills show total consumption over a billing period. They tell you how much energy was used but they do not show when it was used, where it was used or what may have caused unusual patterns. Smart metering data provides a more detailed view.
Depending on the metering arrangement, it can show electricity consumption at regular intervals across a whole site, switchboard, tenant, department, circuit or specific item of equipment. This makes it possible to identify patterns that are hidden in standard billing data. The most useful clue when looking for phantom loads is the site’s baseload.
Baseload is the minimum level of energy use that remains when normal activity is low. For many buildings, this appears overnight, on weekends or during scheduled shutdown periods. A healthy baseload depends on the type of site. Hospitals, data centres and cool room facilities will naturally have higher overnight consumption than a standard office.
The key question is not whether the site uses energy after hours. The key question is whether the level of use is reasonable, explainable and consistent with what should actually be operating.
Start With The Overnight Profile
A good starting point is to review the building’s load profile across several typical days. Look closely at the period between closing time and reopening. For an office, this may be from 7 pm to 6 am. For a retail site, it may be after trading hours. For a manufacturing facility, it may be during scheduled downtime.
If the load drops sharply after hours then settles at a low level, that may indicate a controlled shutdown. If the load remains high throughout the night, there may be idle equipment left running. If the load rises at unexpected times, there may be automated systems starting unnecessarily or equipment operating outside its schedule.
The pattern is often more important than a single reading. A one-off spike may have an explanation. A repeated overnight load suggests a behaviour, setting or system that deserves investigation.
Compare Weekdays, Weekends And Shutdown Periods
Phantom loads often become clearer when you compare different operating periods. A building may have a weekday pattern that looks normal until it is compared with weekend use. If the site is closed on Sunday but energy consumption remains close to weekday levels, the data is telling you something. Holiday shutdowns can be especially useful.
During a planned closure, many loads should reduce significantly. If the smart meter data shows only a small reduction during a shutdown such as Christmas or Easter, there may be background loads that have not been properly isolated.
This type of comparison helps teams move beyond general energy saving advice. Instead of asking people to “switch things off”, facility managers can identify which areas are not actually reducing consumption when activity stops.
Look For Flat Loads And Repeating Patterns
Phantom loads often appear as a flat line in the data. This may indicate equipment drawing a steady amount of power for long periods. Examples can include standby systems, heaters, control panels, pumps, battery chargers, communications equipment or plant that has not been fully shut down.
Repeating patterns are also important. A load that starts every night at the same time may be linked to a timer, building management system or programmed process. A load that cycles regularly may indicate refrigeration, pumping, ventilation or heating equipment.
Once the pattern is visible, the next step is to match it with operations. What should be running at that time? Which area of the site is active? Has anything changed recently? Smart metering data does not just highlight the problem. It gives teams a trail to follow.
Use Submetering To Narrow The Search
Whole-site data is useful but it may not be enough to locate the cause. If a site has a high overnight baseload, the next question is where that load is coming from. Submetering helps break the site into meaningful areas. This may include tenant distribution boards, mechanical services, common areas, lifts, lighting, EV charging, plant rooms, production lines or specific high-value equipment.
By comparing these loads separately, teams can quickly identify which area is responsible for the unexpected consumption. This is where smart metering becomes a practical diagnostic tool. Instead of sending staff to inspect every device, the data helps prioritise effort. If the common area meter shows a steady overnight load, start there. If the mechanical services meter rises every weekend, investigate controls and schedules. If one tenant or department has a much higher background load than others, the issue becomes easier to discuss and resolve.
The table below summarises how different data views help identify different types of phantom loads.
| Data View | Best For Detecting | What To Look For | Common Causes Found |
|---|---|---|---|
| Overnight load profile | Continuous phantom loads | Load that remains elevated when the building should be near-inactive | Equipment left on, standby systems, HVAC not shutting down |
| Weekday vs weekend comparison | Loads unrelated to staff activity | Weekend consumption close to weekday levels on a closed site | Server rooms, chargers, vending machines, security lighting on timer |
| Shutdown period analysis | Loads that were never isolated | Only small reduction during public holidays or planned closures | Centralised plant, BMS-controlled equipment, kitchen equipment on standby |
| Flat load identification | Steady background draws | A flat line in the interval data across long overnight periods | Control panels, communications equipment, water heaters, pumps |
| Repeating pattern analysis | Scheduled or timer-driven loads | Loads starting at the same time each night or cycling at regular intervals | BMS schedules, refrigeration cycling, ventilation systems, timed signage |
| Submetering by zone | Which area or circuit is responsible | One zone with significantly higher background load than others | Specific tenants, plant rooms, common areas, EV chargers, production lines |
Turning Data Into Action
Finding phantom loads is only useful if the information leads to action. Once a likely source is identified, the next step is to check whether the equipment needs to run. Some loads are essential. Security, communications, refrigeration, life safety systems and critical plant may need continuous power. Other loads may be unnecessary, incorrectly scheduled or left running out of habit.
Common actions following a phantom load investigation include adjusting timers, updating building management system settings, switching equipment off properly at the end of the day, installing load controls, separating essential and non-essential loads, repairing faulty equipment and updating operating procedures.
After changes are made, smart metering data can confirm whether the action worked. This verification step is important. It shows the energy reduction clearly and helps build confidence in future energy management decisions.
Using SATEC Meters To Find And Manage Phantom Loads
SATEC’s NMI-approved metering solutions are well suited to identifying and managing phantom loads across commercial, industrial and multi-tenant sites throughout Australia. By capturing detailed energy data at the right points in the electrical network, the meters help turn hidden consumption into visible, measurable information.
For sites that need more than a billing total, the energy metering range can provide interval data across switchboards, circuits, tenants, plant and equipment groups. This level of visibility is valuable when investigating ghost loads, idle loads and other forms of avoidable background consumption. NMI pattern approval means the meters meet Australian trade measurement requirements, which matters particularly for tenant billing and embedded network applications.
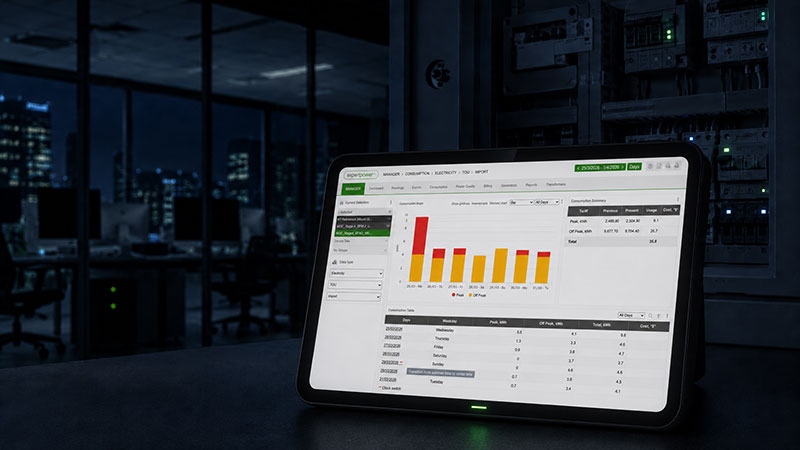
When paired with Expertpower, SATEC’s energy management software, metering data becomes easier to act on. Users can view consumption trends, compare time periods and identify unusual patterns that may otherwise remain hidden in a monthly bill. Detecting a high overnight baseload, unexplained weekend consumption or equipment that continues to draw power outside operating hours becomes a straightforward process rather than a process of guesswork.
The combination of advanced metering, power quality monitoring and a cloud-based analytics platform gives facility managers and energy teams a stronger foundation for decision making. Rather than guessing where energy is being wasted, they can use measured evidence to investigate, act and verify savings.
Smarter Visibility Leads To Better Control
Phantom loads are often ignored because they are invisible. They do not always create noise, heat or obvious disruption. They simply continue using electricity in the background. Smart metering changes that.
By showing when and where energy is being used, it helps Australian organisations identify waste that would otherwise stay hidden. The process does not need to begin with major upgrades or complex assumptions. It can start with a simple question: what is still using power when the building should be quiet? Once that question can be answered with data, phantom loads become easier to find, easier to explain and easier to reduce.
For businesses facing rising energy costs and stronger expectations around sustainability, that visibility is a practical advantage.
FAQs - How To Find Phantom Loads Using Smart Metering Data
What is a phantom load in a commercial building?
A phantom load is electricity drawn by equipment that appears to be switched off or inactive but continues to consume power in the background. Common examples in commercial buildings include standby HVAC components, control panels, vending machines, chargers and communications equipment.
How do I know if my building has a high phantom load?
The clearest sign is an overnight or weekend baseload that remains close to your normal operating consumption, even when the site is closed. Smart metering interval data makes this easy to spot by showing exactly when and how much energy is being used outside business hours.
Do I need submetering to find phantom loads?
Whole-site metering can confirm that a phantom load exists but submetering is needed to pinpoint which zone, circuit or tenant is responsible. Without that breakdown, investigation often comes down to manual inspection rather than targeted action.
Can smart metering data confirm that phantom loads have been fixed?
Yes, and this verification step is one of the most practical benefits of smart metering. Once a change is made, such as adjusting a timer or properly shutting down equipment, the interval data will show a clear reduction in the overnight or weekend baseload.

